Page 1 of 1
大きさ
Posted: Mon May 24, 2021 10:48 am
by hiroko
Gamma should dominate the brain waves during awakening, but why are the Delta waves displayed so high?
Re: 大きさ
Posted: Mon May 24, 2021 10:59 am
by James
Delta is high when you have low quality data with EMG interference, or just a bad sensor connection. Make sure your RAW EEG shows minimal variance, which will indicate good sensor contact.
Re: 大きさ
Posted: Mon May 24, 2021 11:33 am
by hiroko
Thanks for your replay, How can I find out whether RAW EEG shows minimal variance?
Re: 大きさ
Posted: Mon May 24, 2021 11:58 am
by James
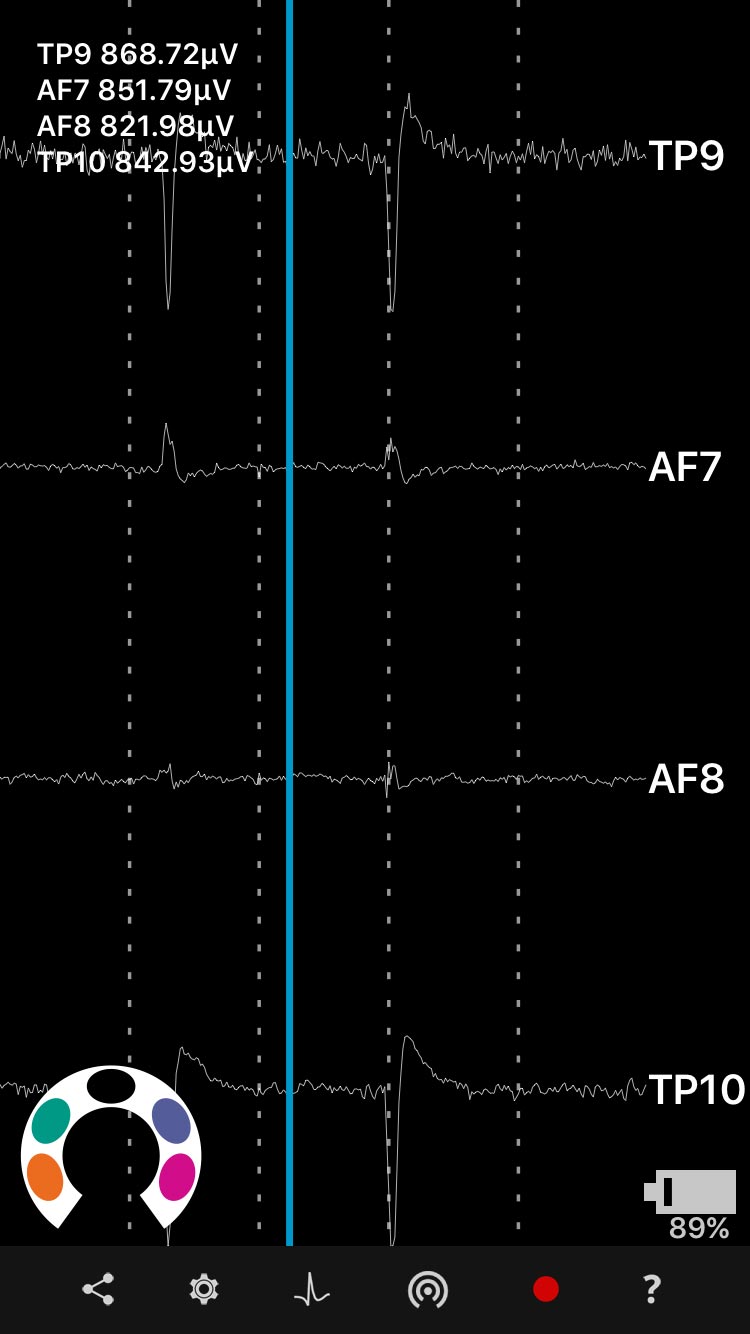
Check the RAW EEG view, which is this one:
https://mind-monitor.com/img/mm-screen-3.jpg
In my example here, you can see that the signal on TP9 is a little "fuzzy" and could be improved for example.
Re: [0]
Posted: Tue May 25, 2021 11:31 am
by hiroko
Looking at the raw data, there was a part where the wave was abnormally high for a moment.
Please let me know if you have any ideas for creating a graph considering (omitting) outliers.
Re: 大きさ
Posted: Tue May 25, 2021 2:35 pm
by James
I can't tell by looking at just these pictures sorry. When recording, check the RAW EEG has minimal variance, this will let you know you have good sensor contact. That's it

Re: 大きさ
Posted: Wed Jun 09, 2021 10:52 am
by hiroko
Thank you very much. I am analyzing the graph with reference to your advice.
What is the base of the logarithm (log) of an Absolute graph?
Re: 大きさ
Posted: Wed Jun 09, 2021 10:55 am
by James
I'm not sure. The values are calculated by Interaxon's algorithms.