大きさ

Post Reply
hiroko
Posts: 15
Joined: Mon May 24, 2021 10:17 am

大きさ

Post by hiroko »

Gamma should dominate the brain waves during awakening, but why are the Delta waves displayed so high?
Attachments
using mcros
using mcros
waves.png (123.17 KiB) Viewed 1690 times
User avatar
James
Site Admin
Posts: 1103
Joined: Wed Jan 02, 2013 9:06 pm

Re: 大きさ

Post by James »

Delta is high when you have low quality data with EMG interference, or just a bad sensor connection. Make sure your RAW EEG shows minimal variance, which will indicate good sensor contact.
hiroko
Posts: 15
Joined: Mon May 24, 2021 10:17 am

Re: 大きさ

Post by hiroko »

Thanks for your replay, How can I find out whether RAW EEG shows minimal variance?
User avatar
James
Site Admin
Posts: 1103
Joined: Wed Jan 02, 2013 9:06 pm

Re: 大きさ

Post by James »

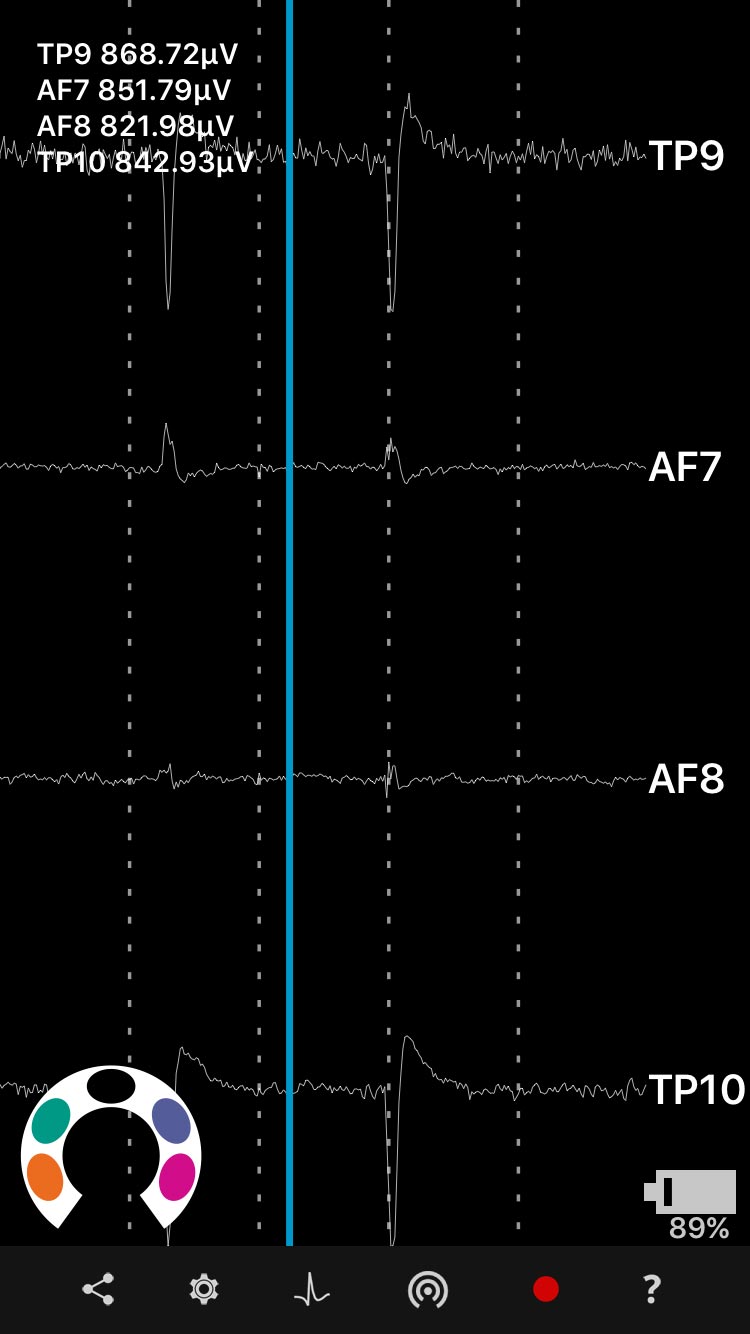
Check the RAW EEG view, which is this one: https://mind-monitor.com/img/mm-screen-3.jpg
In my example here, you can see that the signal on TP9 is a little "fuzzy" and could be improved for example.
hiroko
Posts: 15
Joined: Mon May 24, 2021 10:17 am

Re: [0]

Post by hiroko »

Looking at the raw data, there was a part where the wave was abnormally high for a moment.
Please let me know if you have any ideas for creating a graph considering (omitting) outliers.
Attachments
waves2
waves2
waves2.png (89.06 KiB) Viewed 1678 times
User avatar
James
Site Admin
Posts: 1103
Joined: Wed Jan 02, 2013 9:06 pm

Re: 大きさ

Post by James »

I can't tell by looking at just these pictures sorry. When recording, check the RAW EEG has minimal variance, this will let you know you have good sensor contact. That's it :-)
hiroko
Posts: 15
Joined: Mon May 24, 2021 10:17 am

Re: 大きさ

Post by hiroko »

Thank you very much. I am analyzing the graph with reference to your advice.
What is the base of the logarithm (log) of an Absolute graph?
User avatar
James
Site Admin
Posts: 1103
Joined: Wed Jan 02, 2013 9:06 pm

Re: 大きさ

Post by James »

I'm not sure. The values are calculated by Interaxon's algorithms.
Post Reply