Questions for Muse Monitor Charts & Data Interpretation for Meditators - Part 1

Post Reply
klepper
Posts: 7
Joined: Sun Mar 25, 2018 5:54 pm

Questions for Muse Monitor Charts & Data Interpretation for Meditators - Part 1

Post by klepper »

Am I missing the manual or something somewhere to interpret this data? Flippantly saying “just go get a PhD in neuroscience” or "go buy and read allllll these book on EEG" (http://developer.choosemuse.com/understanding-eeg) is not helpful.

Yes, I have carefully read: http://developer.choosemuse.com/tools/available-data

Yes, I have carefully read: http://musemonitor.com/Technical_Manual.php

I know there are no hard and fast universal rules that apply to everyone’s brain all the time, I know I'm showing my ignorance here but there has to be at least some generalities if using this device for closed-eye MEDITATION analysis. If nobody is going to write up a guide for lay people, I will. Here are my questions: (some may answer themselves with correct previous answers)

When looking @ the chart generated @ http://www.musemonitor.com/Chart.php
0. What is the Y-Axis? Bels (B)?
1. How can there be negative values (previous question may answer this one)
2. If the average Delta is 0.1 (@ day one) and 0.2 (@ day 2), is day 2 4X stronger or 2X stronger? (logarithmic scale?)
3. If (Delta, Theta, Alpha, Beta, Gamma) has the highest amplitude, this generally means ____________________.
4. If the lines are generally level through the whole session, it means ________________
5. If the lines are declining through the whole session, it means ________________

Session Average Relative questions: (5a. What is the RANGE of these scales?)

6. If any 1 variable is more LEFT than RIGHT it means _______________

7. If generally both sides are about equal it means _______________

8. If the LEFT side is dramatically higher than the right it means _______________
left.jpg
left.jpg (6.57 KiB) Viewed 7200 times
Muse Monitor - Average RAW Brain Waves Questions

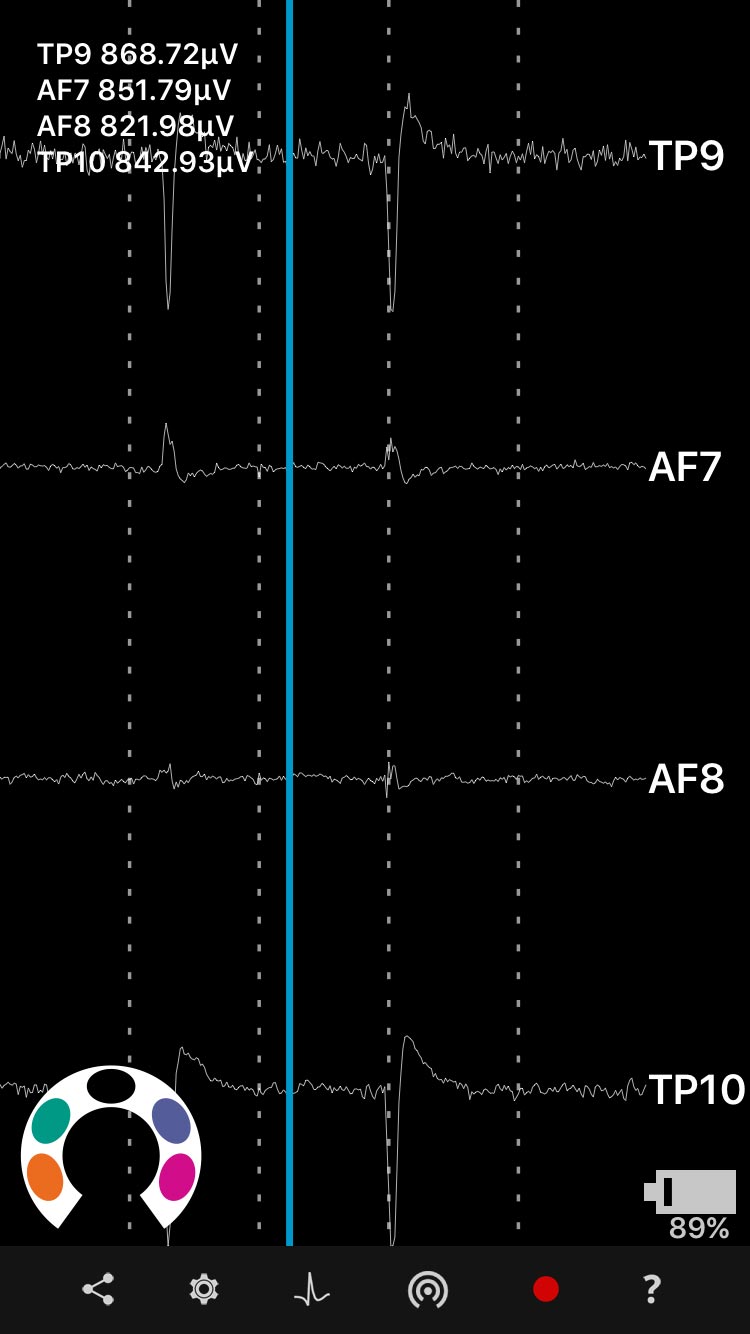
9. This "normal" right? (AF7 AF8) & (TP9 TP10) are in sync:
sync.jpg
sync.jpg (56.99 KiB) Viewed 7200 times
10. What does it mean if one is out of sync?
af8.jpg
af8.jpg (40.92 KiB) Viewed 7200 times

That's enough for now.
User avatar
James
Site Admin
Posts: 1103
Joined: Wed Jan 02, 2013 9:06 pm

Re: Questions for Muse Monitor Charts & Data Interpretation for Meditators - Part 1

Post by James »

Hi,

Before I answer all the questions below, if you're using the Muse for meditation, then the quick and dirty answer is that what you should be looking at is your average Alpha level over the course of a session. Generally higher Alpha means more relaxed.

However, everyone is different, so to work out if your Alpha is high you need to get some baseline "normal" value. The first step is to record some sessions where you're not relaxing and note the average, then compare that to when you are specifically trying to relax and then you've got your number.

Interaxon have not released their algorithm, but I believe that on a very basic level this is what their app does. You do a few training things to get your average, then your relaxation level is the divergence of Alpha from that calculated "normal" point.

It's worth noting that over time, if your meditation is working then your "normal non-relaxed" alpha level will be higher because you are more relaxed in general. So this is another thing you can test and keep track of.

As for your questions:
  • 0. Bels are a unit given to anything which has been calculated via a Fast Fourier Transform. It doesn't say anything about the data other than it's a ratio of something to a reference value, in this case power density, aka more thinking in this frequency band.
  1. I'm not sure what to tell you on this other than it's considered normal for FFT results.
  2. 2x, (I think).
  3. It doesn't specifically mean anything. Each can be considered independent and each is itself a collection of frequencies with can mean many things. One being "high" does not mean another is "low".
  4. Level lines mean little brain activity. The less you're thinking, the less neurons you're going to get firing in your brain and the less the lines will move. If you put the Muse on a potato you'll get perfectly level lines ;-) You're always going to have something because it's impossible not to think and your brain has to think about basic bodily functions like breathing, so you're unlikely to see a totally flat line. During meditation you'll get more level lines because you're just focusing on the single thing of being calm.
  5. Depends on the line see: http://www.choosemuse.com/blog/a-deep-d ... -explained. Going down would mean less chance of being the the states associated with that particular wave form.
  6. There are some people who are interested in what they call coherence where the left and right brain are "balanced", so I added this to the graph page by request. I personally don't think this means much, as the left and right sides of your brain do different things.
  7. See above.
  8. See above.
  9. Yes. AF7/AF8 are the front two electrodes and TP9/TP10 are the rear(ear) sensors. There is usually a pronounced difference between what is picked up by the front and rear sensors.
  10. If one sensor is totally different, then it's probably not fitted correctly. For a good fit you should see raw values only go up and down by ~100uV (unless you're blinking). When you're in Muse Monitor, switch to the RAW graph and adjust the sensor until you get what looks like an almost flat line with only tiny bumps. Here you can see a good connection on all sensors, with sharp spikes in the data only when I am blinking: http://musemonitor.com/img/mm-screen-3.jpg
jacluna
Posts: 1
Joined: Tue Dec 04, 2018 12:57 am

Re: Questions for Muse Monitor Charts & Data Interpretation for Meditators - Part 1

Post by jacluna »

Hi James. I'm a bit confused about the ratio thing you're talking about.

So I'm trying to show the difference between alpha and beta, both in a meditative and attentive state. I want numerical values that can show the changes in relation to each other. Let's say, I have a color that starts to turn blue when the beta is more active and starts to turn red when the alpha is active. Is there an equation or method that I can use to be able to show the changes consistently? Is this what the ratio is referring to?

I hope this makes sense.
User avatar
James
Site Admin
Posts: 1103
Joined: Wed Jan 02, 2013 9:06 pm

Re: Questions for Muse Monitor Charts & Data Interpretation for Meditators - Part 1

Post by James »

This will give you Alpha relative to Beta:

Code: Select all

alpha_relative = (10^alpha_absolute / (10^alpha_absolute + 10^beta_absolute))
einar.kristian
Posts: 1
Joined: Thu Aug 01, 2019 4:29 pm

Re: Questions for Muse Monitor Charts & Data Interpretation for Meditators - Part 1

Post by einar.kristian »

Hi James,

Any progress on the coherence addition to graphs, check out https://www.youtube.com/watch?v=o3qTkt5Qpps.

Please note that I get a warning from the Firefox browser that the login is insecure and that login information may be compromised.

Regards Einar
User avatar
James
Site Admin
Posts: 1103
Joined: Wed Jan 02, 2013 9:06 pm

Re: Questions for Muse Monitor Charts & Data Interpretation for Meditators - Part 1

Post by James »

You can already look at coherence by going to settings and changing the displayed signals from their default of Average (all four sensors) to Left/Right groups.

Re Firefox, I have updated all links to the forums to be https instead of http, so you shouldn't get that error any more. If you have a link saved in your browser, just change it from http:// to https:// and it'll fix it.
Post Reply