idk how to read the descrete graph
-
ShnitzlesRada
- Posts: 2
- Joined: Sun Feb 14, 2021 2:50 am
idk how to read the descrete graph
I am only interested in reading the Hz of my brainwaves to see what frequency I am currently in. Correct me if I'm wrong but your brain runs on alpha, beta, theta, delta, and gamma all at once with one being the most prominent? How do I tell which brainwave I am in using the discrete graph? I want to know when I am in theta. You've mentioned before that the discrete graph is the one to read for that. Only problem is I don't understanding how to read the graph. What are the numbers on the left supposed to identify?

Re: idk how to read the descrete graph
Yes, all brainwaves happen at the same time; It's a very analogue thing.ShnitzlesRada wrote: ↑Sun Feb 14, 2021 4:00 am I am only interested in reading the Hz of my brainwaves to see what frequency I am currently in. Correct me if I'm wrong but your brain runs on alpha, beta, theta, delta, and gamma all at once with one being the most prominent?
You're always using all waves, just in different amounts. The colored areas show you which brainwaves each frequency component is a part of (e.g. the blue area is Alpha). You can't tell easily from the discrete graph which wave is higher overall than another, that's easier to see from the absolute graph.ShnitzlesRada wrote: ↑Sun Feb 14, 2021 4:00 amHow do I tell which brainwave I am in using the discrete graph?
You want to use the absolute graph to see which wave is higher, not the discrete graph.ShnitzlesRada wrote: ↑Sun Feb 14, 2021 4:00 am I want to know when I am in theta. You've mentioned before that the discrete graph is the one to read for that. Only problem is I don't understanding how to read the graph.
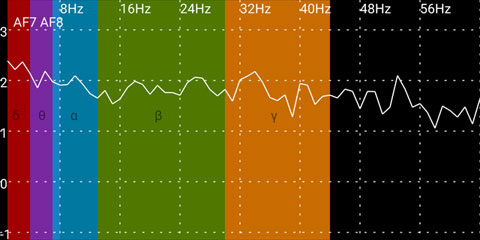
The reason to use the discrete graph is if you want to know if a certain specific frequency is spiking more than another. For example, in this discrete graph taken from the help, you can see a small spike in Alpha in the middle of the range, around 10Hz. If you're looking specifically for a spike at a certain frequency, then this is how you would find it.
For a more striking example of this, walk next to a floor lamp and you will see a large 50/60Hz (depending on your area of the world) spike from the mains electricity getting picked up by the Muse.
The numbers are the Power Spectral Density of the frequency bin, as calculated by the Fast Fourier Transform of the RAW EEG data.ShnitzlesRada wrote: ↑Sun Feb 14, 2021 4:00 amWhat are the numbers on the left supposed to identify?
-
ShnitzlesRada
- Posts: 2
- Joined: Sun Feb 14, 2021 2:50 am
Re: idk how to read the descrete graph
so in the absolute graph, when the theta line is the highest im in theta, but it doesnt show exactly what frequency you are in?
-
Sam808good
- Posts: 1
- Joined: Fri Mar 12, 2021 1:25 pm
Re: idk how to read the descrete graph
thank you James for your explain , I followed your explain
I will attach my brainwave image, I want to reach theta state. Am I there ?
Could you explain the graph a little bit more.
Could you explain the numbers on "Mind Monitor - Absolute Brain Waves" ?
Is delta suppose to be the highest number in normal state ?
I will attach my brainwave image, I want to reach theta state. Am I there ?
Could you explain the graph a little bit more.
Could you explain the numbers on "Mind Monitor - Absolute Brain Waves" ?
Is delta suppose to be the highest number in normal state ?
- Attachments
-
- 2.png (131.88 KiB) Viewed 8859 times
-
- mindMonitor_2021-03-12--21-18-10.zip
- (12.39 KiB) Downloaded 888 times
Re: idk how to read the descrete graph
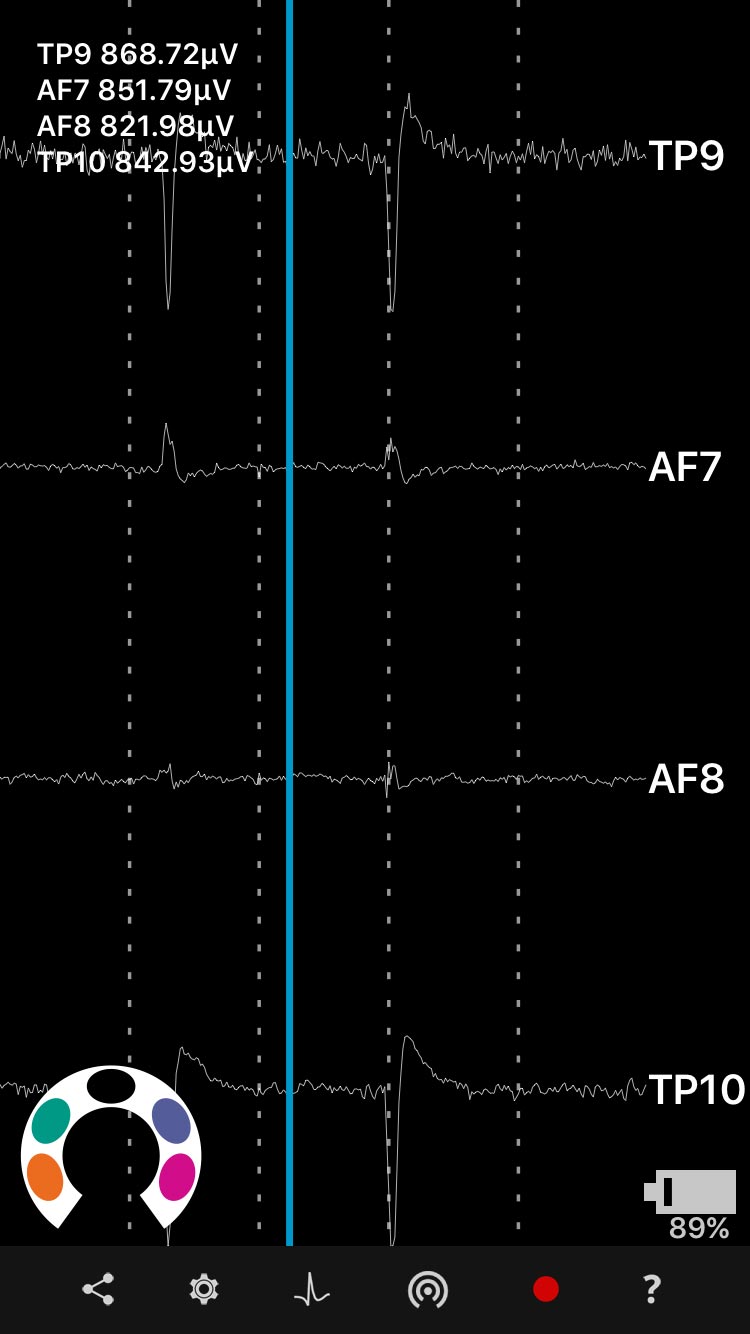
You have "J" Jaw Clench markers around 9:18:18, which means either you are clenching your jaw or you just have not got a good fit of the Muse on your head. This will create EMG interference and is likely why Delta is high throughout this recording.
If we ignore Delta for this reason, then you mostly have high Alpha, as Alpha is the blue line nearest to the top for the majority of this recording.
Theta is the purple line and is very low for most of this graph except at the very beginning near the Jaw Clench markers, where likely all the data is very bad.
Switch to the RAW EEG view when recording and make sure you have thin crisp lines. The more "fuzzy" the line the worse your signal is. See the screenshot on the homepage for an example of good RAW EEG: https://mind-monitor.com/img/mm-screen-3.jpg
Raising Theta with Binaural Beats
Do you agree that a high theta means a deeper meditative state then high alpha? I have been listening to Binaural Beats where different frequencies are isolated. However, I always see Alpha at the peak and Theta kind of bounces around, and Gamma is lowest. Any suggestions what goals to set using mind-monitor as a bio-feedback tool?