Three somewhat-related questions:
1. What is the Y axis on the online chart?
2. Considering alpha and beta et. al. vibrate at different frequency ranges, how do the relative or absolute charts (or the live data) give me the necessary feedback to improve my meditation practice?
3. is there a way to tell the actual frequency of the alpha or theta etc. waves? I understand it is a range, but I am listening to a state training audio program that is looking to give me a 2:1 harmonic between alpha and theta, meaning I'm trying to get my alpha at 12Hz and the theta at 6Hz. It would be great if I could translate the data from my MUSE headband using mind monitor to know what is really happening in my brainwaves.
Thanks, James!
Frequencies of different bands

Re: Frequencies of different bands
#1 - I'm assuming you mean the absolute / relative chart, in which case it's power spectral density.
#2 - As a rule, I leave intrepretation of the data down to the user as there are many conflicting theories on what good meditation looks like in brainwaves, but from my personal research, you should be looking for high relative Alpha.
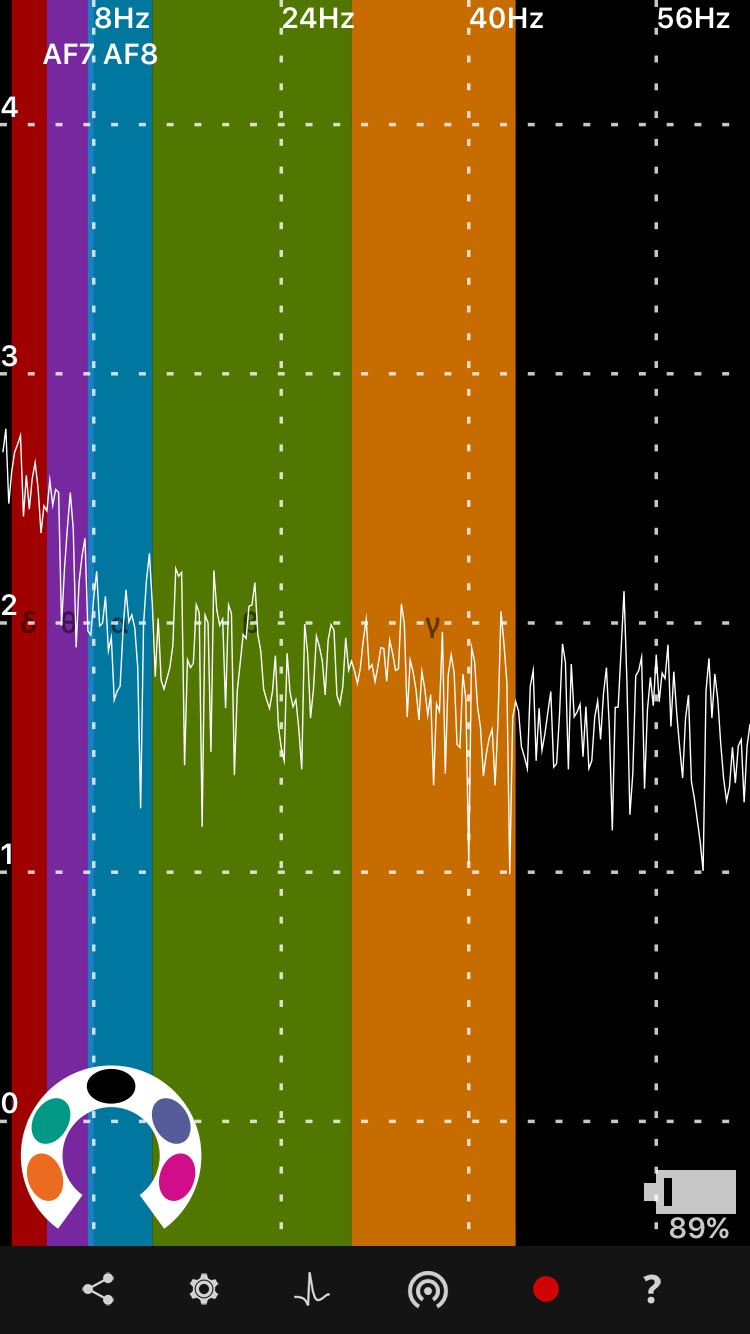
#3 - Waves, e.g. Alpha are the power spectral density of a range of frequencies. You have all frequencies happening all the time. If you want to see this, switch to the discrete frequency graph in the app. (https://mind-monitor.com/img/mm-screen-2.jpg). You can't "get alpha to 12Hz", because by definition Alpha already includes 12Hz. It's like saying you want to get your rainbow to red.. red is part of the rainbow. If you're just looking at red light, that's not a rainbow If you want to know the saturation of red, that's a thing independent of the rainbow. Similarly, if you want to know the power spectral density of 12Hz, then you can work that out. You need to set your "Recording Interval" to "Constant" in settings, to record the full 256Hz RAW EEG signals, and then process them in MATLAB using an FFT (Fast Fourier Transform). I would also recommend using a hamming filter. It's a LOT of complex math, but it will give you a single number for the power spectral density of 12Hz independant of Alpha.
#2 - As a rule, I leave intrepretation of the data down to the user as there are many conflicting theories on what good meditation looks like in brainwaves, but from my personal research, you should be looking for high relative Alpha.
#3 - Waves, e.g. Alpha are the power spectral density of a range of frequencies. You have all frequencies happening all the time. If you want to see this, switch to the discrete frequency graph in the app. (https://mind-monitor.com/img/mm-screen-2.jpg). You can't "get alpha to 12Hz", because by definition Alpha already includes 12Hz. It's like saying you want to get your rainbow to red.. red is part of the rainbow. If you're just looking at red light, that's not a rainbow
Re: Frequencies of different bands
thanks for the thorough answer, James!
Now I need to read up and better understand power spectral density, so you can be sureI'm not a neuroscientist (yet).
The frequency graph is very helpful, and I believe having the alpha at a higher power than say beta is what I'l getting and what you think I should be looking for.
Until my next question...
Cheers!
-Brian